Dixon Technologies Q4 FY26 Results: Revenue Crosses ₹10,500 Crore But Profit Falls 36% — What Investors Must Know
By Kaushik Brahmakshatriya
Published On 14 May 2026.
Dixon Technologies Q4 FY26 Results
India’s largest Electronics Manufacturing Services (EMS) company, Dixon Technologies (India) Ltd, declared its Q4 FY26 financial results on May 12, 2026. While the company delivered robust full-year numbers, the March quarter painted a mixed picture — strong on revenue but under pressure on the profit front. Here is a complete breakdown of Dixon Technologies Q4 FY26 results, what went wrong, what went right, and what investors should watch going forward.
Dixon Technologies Q4 FY26: Key Highlights at a Glance
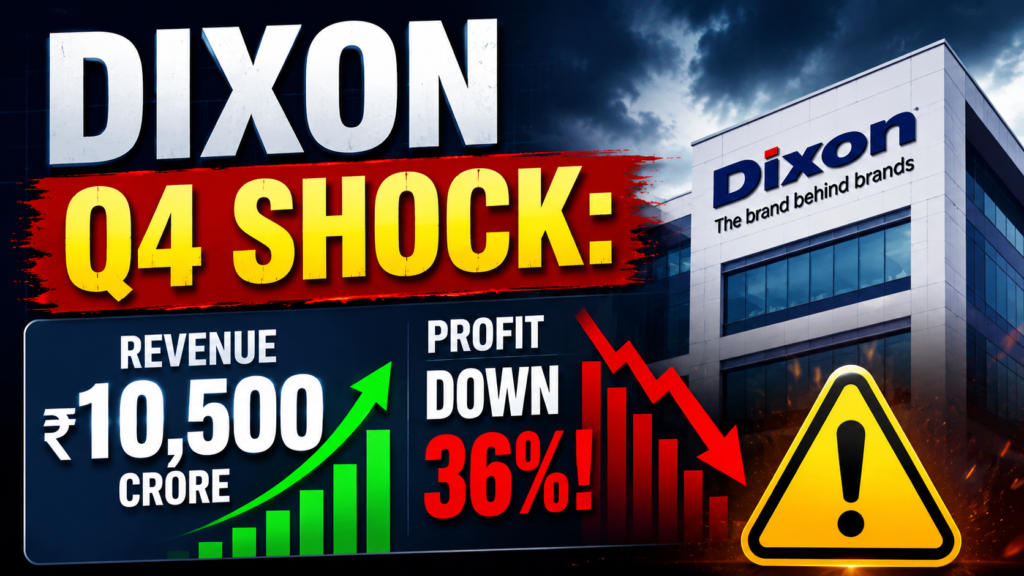
Dixon Technologies reported consolidated net sales of ₹10,510.51 crore for the quarter ended March 31, 2026, a 2.12% year-on-year increase from ₹10,292.54 crore in Q4 FY25. However, consolidated net profit (PAT) slumped 36.03% year-on-year to ₹256.41 crore compared with ₹400.82 crore in the same quarter last year.
EBITDA for the quarter rose 9% year-on-year to ₹493 crore, yet operating margins contracted to 3.89% from 4.30% in Q4 FY25 — a reflection of mounting cost pressures and a shift in business mix. Profit before tax fell sharply to ₹370 crore from ₹576 crore in Q4 FY25, declining 35.8% in just one year.
Total expenses for Q4 FY26 rose to ₹10,230.77 crore from ₹9,981.92 crore in Q4 FY25. Employee benefit costs surged 21.39% YoY to ₹174 crore, significantly outpacing revenue growth. Depreciation expenses also climbed to ₹105 crore during the quarter.
Despite quarterly weakness, the results exceeded analyst expectations — Zee Business research had estimated Q4 PAT of only ₹164 crore, making the actual ₹256 crore a beat on the street.
Dixon Technologies Q4 FY26 Quarterly Financial Snapshot (Consolidated)
| Metric | Q4 FY26 | Q4 FY25 | YoY Change |
| Revenue from Operations | ₹10,510.51 Cr | ₹10,292.54 Cr | +2.12% |
| Total Income | ₹10,595 Cr | ₹10,304 Cr | +2.82% |
| EBITDA | ₹493 Cr | ₹452 Cr | +9.07% |
| EBITDA Margin | 3.89% | 4.30% | -41 bps |
| Profit Before Tax | ₹370 Cr | ₹576 Cr | -35.76% |
| Net Profit (PAT) | ₹256.41 Cr | ₹400.82 Cr | -36.03% |
| Employee Costs | ₹174 Cr | ₹143.32 Cr | +21.39% |
| Total Expenses | ₹10,230.77 Cr | ₹9,981.92 Cr | +2.49% |
Full-Year FY26 Performance: A Much Brighter Picture
While Q4 FY26 was a soft quarter, the full year FY26 consolidated financials tell a much more encouraging story. Dixon Technologies closed FY26 with ₹49,586 crore in consolidated revenue, growing 28% year-on-year from the previous year.
Full-year EBITDA jumped an impressive 69% to ₹2,580 crore. Net profit for FY26 rose 33% to ₹1,644 crore from ₹1,233 crore in FY25. Profit before tax also advanced 32% to ₹2,071 crore. Diluted EPS for FY26 climbed to ₹269.35 from ₹202.58 in FY25 — a significant jump in per-share earnings reflecting genuine business scale-up.
The standalone financials also reflected strong growth — annual net profit rose to ₹759.44 crore from ₹565.90 crore in FY25, while total standalone income stood at ₹4,73,246 lakh for FY26.
Dixon Technologies FY26 vs FY25 — Full-Year Consolidated Comparison
| Metric | FY26 | FY25 | YoY Growth |
| Total Revenue | ₹49,586 Cr | ₹38,739 Cr | +28% |
| EBITDA | ₹2,580 Cr | ₹1,527 Cr | +69% |
| Profit Before Tax | ₹2,071 Cr | ₹1,569 Cr | +32% |
| Net Profit (PAT) | ₹1,644 Cr | ₹1,233 Cr | +33% |
| Diluted EPS (₹) | ₹269.35 | ₹202.58 | +32.96% |
| Standalone Net Profit | ₹759.44 Cr | ₹565.90 Cr | +34.2% |
Dividend and ESOP Announcement
The Board of Directors of Dixon Technologies recommended a final dividend of ₹10 per equity share of face value ₹2 each for FY26. This translates to a 500% dividend payout — a significant reward for long-term shareholders. The dividend is subject to approval at the 33rd Annual General Meeting and will be credited within 30 days from the date of shareholder approval.
Additionally, the board approved the grant of 16,155 stock options to eligible employees under the ESOP 2023 scheme. These options will vest over three years from the date of grant, helping Dixon retain and incentivise its growing talent pool.
Why Did Dixon Technologies Q4 Profit Fall So Sharply?
The 36% PAT decline in Q4 FY26 was driven by a combination of factors. First, employee costs rose disproportionately relative to revenue — a sign of aggressive capacity hiring ahead of future demand. Second, business transitions across product segments temporarily compressed margins. Third, depreciation costs climbed due to ongoing capital expenditure and infrastructure expansion.
Margin compression from 4.30% to 3.89% may look small in percentage terms, but at Dixon’s scale — over ₹10,000 crore in quarterly revenue — even a few basis points translate into hundreds of crores in lost profit.
Dixon Technologies Shareholding Pattern — March 2026 vs March 2025
| Investor Category | March 2026 (%) | March 2025 (%) | Change |
| Promoters | 28.68% | 32.27% | -3.59% |
| Foreign Institutional Investors (FIIs) | 18.29% | 21.81% | -3.52% |
| Domestic Institutional Investors (DIIs) | — | — | Rising |
| Public / Retail | Balance | Balance | Stable |
The decline in promoter holding from 32.27% to 28.68% occurred largely in June 2025, possibly due to regulatory or liquidity requirements. FII holding has also declined steadily over the year — a signal that global investors are cautious about near-term profit trajectory.
Dixon Technologies Share Price Reaction
The stock reacted negatively on result day — falling 5.87% to close at ₹10,138.50 on May 12, 2026 on NSE. However, the following day brought a strong recovery — Dixon Technologies shares surged nearly 7.90% to ₹10,939, likely driven by the FY26 full-year outperformance and the attractive dividend announcement.Over the past one year, Dixon Technologies has declined approximately 37%, significantly underperforming the Sensex which fell around 9.55% in the same period. Brokerage target prices post-results range between ₹9,790 and ₹15,000, reflecting widely divergent views on near-term versus long-term value.
Long-Term Fundamentals Remain Strong
Despite quarterly turbulence, Dixon Technologies’ fundamental strengths remain intact. The company’s Return on Equity (ROE) stands at 31.12% and ROCE at 31.75% —
both exceptionally high for a manufacturing business, validating its asset-light EMS model. The company’s core operating profit (PBT pre-exceptional) rose 87.6% YoY in FY26, which is the truest reflection of operating leverage.
Dixon is also deeply embedded in India’s PLI (Production Linked Incentive) scheme for electronics, making it the preferred manufacturing partner for several global brands entering India. Product premiumisation across smartphones, IT hardware, and wearables will be the key driver for margin expansion in future quarters.
Frequently Asked Questions (FAQ) — Dixon Technologies Q4 FY26 Results
Q1. When were Dixon Technologies Q4 FY26 results declared?
Dixon Technologies declared its Q4 FY26 results on May 12, 2026, after a board meeting that also approved the dividend and ESOP grant recommendations.
Q2. What was Dixon Technologies’ Q4 FY26 net profit?
Dixon Technologies reported a consolidated net profit (PAT) of ₹256.41 crore in Q4 FY26, a decline of 36.03% year-on-year from ₹400.82 crore in Q4 FY25.
Q3. What was Dixon Technologies’ revenue in Q4 FY26?
Revenue from operations came in at ₹10,510.51 crore, up 2.12% YoY. Total income including other income stood at ₹10,595 crore.
Q4. What dividend did Dixon Technologies announce for FY26?
The board recommended a final dividend of ₹10 per equity share (face value ₹2), representing a 500% payout, subject to shareholder approval at the AGM.
Q5. How did Dixon Technologies perform for the full year FY26?
For the full year FY26, Dixon Technologies posted consolidated revenue of ₹49,586 crore (up 28% YoY), PAT of ₹1,644 crore (up 33% YoY), and EBITDA of ₹2,580 crore (up 69% YoY) — strong annual numbers despite the soft Q4.
Q6. Why did Dixon Technologies’ profit fall in Q4 FY26?
The profit decline was caused by margin compression (EBITDA margin dropped to 3.89%), a 21.39% surge in employee costs, rising depreciation, and business transition costs across segments. It was not a revenue problem but a cost and margin issue.
Q7. What is Dixon Technologies’ Return on Equity (ROE)?
Dixon Technologies’ ROE stands at 31.12% and ROCE at 31.75%, indicating strong long-term capital efficiency despite near-term quarterly pressures.
Conclusion: A Mixed Quarter, But a Strong Year
Dixon Technologies’ Q4 FY26 results were a tale of two narratives — a soft quarter dragged by margin pressure and rising costs, but a stellar full year that confirmed the company’s position as India’s undisputed EMS champion. With FY26 EBITDA up 69%, full-year PAT up 33%, an attractive dividend of ₹10 per share, and deep integration with India’s PLI electronics push, Dixon’s long-term investment thesis remains compelling. Investors watching for margin recovery and operational efficiency improvement in Q1 FY27 will have their next key data point in the coming months.
Disclaimer :
This blog does not provide financial, investment, or trading advice. All content is for educational and informational purposes only. Please consult a certified financial advisor before making any investment decisions. The author will not be responsible for any financial losses incurred