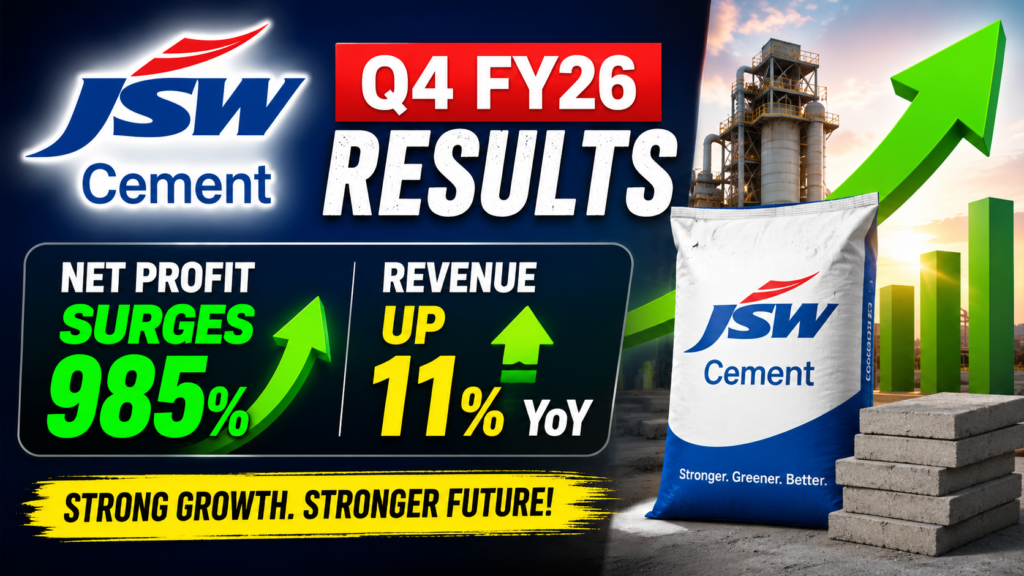
JSW Cement Q4 FY26 Results: Net Profit Surges 985%, Revenue Up 11% YoY — Full Analysis
By Kaushik Brahmakshatriya
Published On 23 May 2026.
JSW Cement Q4 FY26 Results
JSW Cement Limited delivered one of its strongest quarterly performances in recent history when it announced its consolidated financial results for Q4 FY26 (January–March 2026) on May 21, 2026. The company posted a significant jump in total income and net profit, reflecting its strengthening market position within India’s highly competitive cement industry.
The market responded enthusiastically, with shares climbing sharply on the results day.
Company Overview
JSW Cement is part of the diversified JSW Group and operates across the entire value chain of building materials, including cement, ground granulated blast-furnace slag (GGBS), concrete, and construction chemicals.
The company runs seven manufacturing plants across India and has been aggressively expanding its geographic footprint to establish a pan-India presence.
Q4 FY26 Key Financial Highlights
Total volume sold grew to 3.99 million tonnes in Q4 FY26 from 3.73 million tonnes in Q4 FY25, marking a 7% year-on-year increase. Revenue came in at ₹1,895 crore, an 11% rise compared to ₹1,709 crore in Q4 FY25. Operating EBITDA stood at ₹365 crore, up 46% year-on-year, with an operating EBITDA margin of 19.3%.
JSW Cement Q4 FY26 — Quarterly Performance Snapshot
| Metric | Q4 FY25 | Q4 FY26 | YoY Change |
| Revenue (₹ Crore) | ₹1,709 | ₹1,895 | +11% |
| Operating EBITDA (₹ Crore) | ₹249 (approx.) | ₹365 | +46% |
| EBITDA Margin | 14.01% | 19.29% | +528 bps |
| Net Profit (₹ Crore) | ₹34.22 | ₹371.33 | +985% |
| Volume Sold (Million Tonnes) | 3.73 MT | 3.99 MT | +7% |
The EBITDA margin expanded significantly to 19.29% in Q4 FY26 compared to 14.01% in the same quarter last year, indicating strong cost efficiency and improved operational leverage during the quarter.
Full Year FY26 Performance
While Q4 results were impressive, the full-year picture carries a note of caution due to a large one-time charge in Q1 FY26.
JSW Cement FY26 — Full Year Financial
| Metric | FY25 | FY26 | Change |
| Revenue from Operations (₹ Crore) | ₹5,812 | ₹6,512 | +12% |
| Operating EBITDA (₹ Crore) | ₹861 (approx.) | ₹1,240.3 | +44% |
| EBITDA Margin | — | 19.0% | — |
| Total Volume (Million Tonnes) | 12.57 | 13.96 | +11% |
| Adjusted PAT (₹ Crore) | — | ₹667.6 | — |
| Net Loss (Reported) | ₹114 crore | ₹756 crore | Widened |
For FY26, revenue from operations increased 12% year-on-year to ₹6,512 crore, while operating EBITDA improved by 44% to ₹1,240.3 crore. Total volume sold was 13.96 million tonnes, up 11% year-on-year.
The reported annual net loss of ₹756 crore is primarily explained by a non-cash exceptional charge. A significant non-cash exceptional expense of ₹1,466.4 crore was recorded in Q1 FY26, arising from the fair value treatment of pre-IPO conversion of 16 crore Compulsorily Convertible Preference Shares (CCPS) into equity shares in July 2025. This charge did not affect Q4 FY26 at all.
Capacity Expansion: Nagaur Plant & Future Capex
A major highlight of the Q4 announcement was progress on JSW Cement’s ambitious capacity expansion roadmap.
The company commissioned the first phase of its Nagaur integrated unit in Rajasthan during Q4 FY26, comprising 3.3 MTPA of clinker capacity and 2.5 MTPA of grinding capacity. Work on the waste heat recovery system (WHRS) and an additional 1.0 MTPA grinding capacity at the Nagaur facility is nearing completion.
To optimise the new clinker line at Nagaur, the board has approved an additional capital expenditure of ₹430 crore to add another 2.5 MTPA of cement grinding capacity at the site, which will bring the total grinding capacity at Nagaur to 6.0 MTPA.
expansion programme aimed at building a pan-India presence, targeting 46.0 MTPA of grinding capacity and 13.04 MTPA of clinker capacity.
Nagaur Plant Capacity Expansion Roadmap
| Phase | Capacity | Status |
| Phase 1 — Clinker | 3.3 MTPA | Commissioned Q4 FY26 |
| Phase 1 — Grinding | 2.5 MTPA | Commissioned Q4 FY26 |
| Phase 2 — Grinding (1 MTPA) | 1.0 MTPA | Under implementation |
| Phase 3 — Grinding (Approved) | 2.5 MTPA | Approved; ₹430 Cr capex |
| Total Nagaur Grinding (Post-expansion) | 6.0 MTPA | Target: Jan 2028 |
Dividend & Stock Market Reaction
JSW Cement’s board of directors recommended a dividend of ₹0.50 (5%) per equity share of ₹10 face value for the financial year ended March 31, 2026.
On the stock market front, the results triggered a sharp rally. JSW Cement shares surged approximately 7% to ₹136.44 on the NSE, driven by a better-than-expected operational performance. JM Financial reiterated its ‘Buy’ rating with a target price of ₹155, citing strong Q4 performance and EBITDA that exceeded estimates by 5–8%.
Analyst View & Outlook
JSW Cement’s management reiterated guidance for mid-to-high teens cement volume growth (excluding the north plant) for FY27, while GGBS is expected to outperform industry growth, supporting continued volume-led expansion.
The sequential jump from Q3 FY26 to Q4 FY26 across all major metrics — especially the improvement in EBITDA per tonne — shows that the company is successfully passing on costs and benefiting from operating leverage.
FAQ — People Also Ask
Q1. What was JSW Cement’s net profit in Q4 FY26?
JSW Cement reported a consolidated net profit of approximately ₹371 crore in Q4 FY26, a jump of nearly 985% compared to ₹34.22 crore posted in Q4 FY25.
Q2. What was JSW Cement’s revenue in Q4 FY26?
Revenue from operations reached ₹1,895 crore in Q4 FY26, marking an 11% year-on-year increase from ₹1,709 crore in Q4 FY25.
Q3. What is JSW Cement’s EBITDA margin for Q4 FY26?
The operating EBITDA margin expanded to 19.29% in Q4 FY26, up from 14.01% in the same quarter last year, reflecting improved cost management and better blended product mix.
Q4. Did JSW Cement announce a dividend for FY26?
Yes. JSW Cement’s board recommended a dividend of ₹0.50 per equity share (5% on face value of ₹10) for the financial year ended March 31, 2026.
Q5. What is JSW Cement’s expansion plan at Nagaur?
JSW Cement commissioned Phase 1 of the Nagaur integrated plant in Q4 FY26. The board has further approved 2.5 MTPA additional grinding capacity at the site with a capex of ₹430 crore, targeting commissioning by January 2028 and bringing total Nagaur grinding capacity to 6.0 MTPA.
Q6. Why did JSW Cement report a full-year net loss in FY26 despite a strong Q4?
The full-year reported net loss of ₹756 crore was primarily caused by a one-time non-cash charge of over ₹1,466 crore in Q1 FY26, related to the fair-value treatment of pre-IPO conversion of preference shares into equity. Adjusted PAT for FY26 stood at a positive ₹667.6 crore.
Conclusion
JSW Cement’s Q4 FY26 results mark a clear inflection point for the company. With EBITDA up 46%, margins near 20%, volumes growing, the Nagaur plant now operational, and fresh capacity approved for FY28, JSW Cement is firmly on a growth trajectory. Investors and analysts alike will be closely watching volume ramp-up at Nagaur and debt reduction progress in the quarters ahead.
Disclaimer
This blog does not provide financial, investment, or trading advice. All content is for educational and informational purposes only. Please consult a certified financial advisor before making any investment decisions. The author will not be responsible for any financial losses incurred