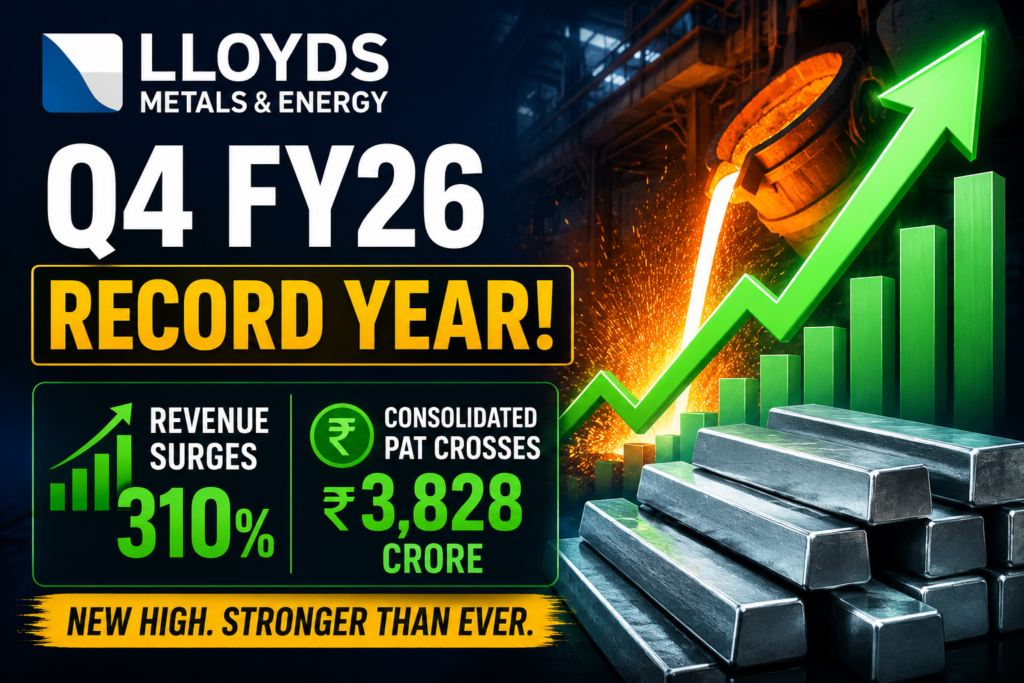
Lloyds Metals and Energy Q4 FY26 Results: Revenue Surges 310%, Consolidated PAT Crosses ₹3,828 Crore — A Record-Breaking Year
By Kaushik Brahmakshatriya
Published On 05 June 2026.
Lloyds Metals and Energy Q4 FY26 Results
Lloyds Metals and Energy Limited (NSE: LLOYDSME) has delivered one of the most impressive financial performances in its corporate history for Q4 FY26 and the full financial year 2025–26. The Board of Directors approved the audited standalone and consolidated financial results on May 5, 2026, and the numbers speak volumes about the company’s rapid transformation from a mid-sized metals player into one of India’s most aggressive growth stories in the iron ore and steel value chain.
What Happened in Q4 FY26?
In the quarter ended March 31, 2026, Lloyds Metals delivered a standout performance on both standalone and consolidated metrics. Standalone income for Q4 FY26 reached ₹4,977 crore, marking a massive 310% year-on-year jump compared to the same period last year. This sharp spike was primarily powered by the full ramp-up of the company’s pellet plant and a record surge in iron ore volumes.
On an EBITDA level, the quarterly figure climbed to ₹1,678 crore, which represents nearly 498% growth year-on-year — a number that underlines exceptional operating leverage. EBITDA margin for Q4 FY26 stood at 33.73%, reflecting the company’s improved product mix, higher share of value-added pellets, and a tight grip on operational costs.
On a consolidated basis, Q4 FY26 figures showed profit before tax of ₹2,164 crore, a 43% jump over Q3 FY26’s ₹1,518 crore. EBITDA on a consolidated basis improved 38% quarter-on-quarter to ₹2,556 crore, and the consolidated EBITDA margin expanded by 639 basis points QoQ to 42.39% in the March 2026 quarter.
Lloyds Metals & Energy — Q4 FY26 vs Q3 FY26 Key Financials (Consolidated)
| Metric | Q4 FY26 | Q3 FY26 | QoQ Change |
| Total Income | ₹1,212.6 Cr (standalone: ₹4,977 Cr) | ₹2,850 Cr (est.) | +310% YoY standalone |
| EBITDA | ₹2,556.5 Cr | ₹1,853 Cr | +38% QoQ |
| EBITDA Margin | ₹2,556.5 Cr | ₹1,853 Cr | +639 bps QoQ |
| Profit Before Tax | ₹2,164.6 Cr | 35.99% | +43% QoQ |
| Net Profit (PAT) | ₹244.6 Cr (standalone Q4)—— | — | — |
FY26 Full Year: A Transformational Year for LMEL
The annual numbers are where the real story lies. Lloyds Metals closed FY26 with a consolidated revenue of ₹17,000+ crore, growing 104% year-on-year, compared to ₹8,400 crore in FY25. Total income on a standalone basis came in at ₹13,838 crore — again a 104% annual jump.
Consolidated PAT for FY26 stood at ₹3,828.64 crore, a stunning 163% increase over ₹1,455 crore in FY25. The standalone PAT was ₹3,194 crore. EBITDA for the full year grew 133% to ₹4,673 crore on a standalone basis, with the full-year margin at 33.77%.
The company’s five-year track record reinforces this momentum — it has achieved a 109% CAGR in revenue and 139% CAGR in profit over the last five years, making it one of the fastest-compounding businesses in India’s metals sector.
Lloyds Metals & Energy — FY26 vs FY25 Annual Comparison (Standalone)
| Financial Metric | FY26 | FY25 | YoY Growth |
| Total Income | ₹13,838 Cr | ₹6,787 Cr | +104% |
| EBITDA | ₹4,673 Cr | ₹2,005 Cr | +133% |
| EBITDA Margin | 33.77% | 29.5% (approx.) | Expanded |
| PAT (Standalone) | ₹3,194 Cr | ₹1,531 Cr | +109% |
| PAT (Consolidated) | ₹3,828.64 Cr | ₹1,455.3 Cr+163% | +163% |
| Total Income (Consol.) | ₹17,306 Cr | ₹6,786 Cr | +155% |
Operational Highlights — Volume Growth Drives the Earnings Engine
Lloyds Metals’ financial outperformance was underpinned by exceptional production volumes during FY26:
- Iron ore production for FY26 reached 21.96 million tonnes, up 120% YoY from 10 million tonnes in FY25.
- Q4 FY26 iron ore volumes surged a remarkable 529% YoY to 9.1 million tonnes.
- DRI (sponge iron) production touched 4.84 lakh tonnes, up 57% YoY.
- The company’s pellet plant achieved 100% capacity utilization, producing 3.03 million tonnes of pellets in FY26.
- The second 4 MTPA pellet plant at Konsari was commissioned in record time, boosting pelletization capacity.
Capital expenditure for FY26 was ₹8,131 crore, invested in slurry pipelines, infrastructure upgrades, and capacity additions — laying the foundation for further scaling in FY27.
Lloyds Metals — FY26 Operational Performance Summary
| Operational Metric | FY26 | FY25 | YoY Change |
| Iron Ore Production | 21.96 MT | 10 MT | +120% |
| Q4 Iron Ore Volume | 9.1 MT | 1.45 MT (est.) | +529% |
| DRI Production | 4.84 Lakh T | 3.09 Lakh T | +57% |
| Pellet Production | 3.03 MT | — (plant new) | 100% capacity |
| Capex (FY26) | ₹8,131 Cr | ₹3,200 Cr (est.) | Major step-up |
Board Decisions and Strategic Moves
Beyond the results, the May 5 board meeting was eventful. Key decisions approved include:
- Final dividend of ₹1 per equity share (100% on face value of ₹1) for FY26, subject to shareholder approval at the upcoming AGM scheduled for June 19, 2026. This marks the first dividend in the company’s history.
- Allotment of 75,000 unsecured NCDs aggregating ₹750 crore on a private placement basis, strengthening the balance sheet.
- Approval for enabling NCDs of up to ₹2,500 crore for future fundraising.
- A 49% stake acquisition in Chemaf, entering the global copper-cobalt market in the Democratic Republic of Congo (DRC).
- A stake in a Papua New Guinea (PNG) mining project, adding an international dimension to the company’s resource portfolio.
Management has also guided for 39% yearly volume growth in iron ore from the Odisha operations, targeting 34–35 million tonnes for FY27.
Management Commentary
MD Rajesh Gupta highlighted during the Q4 FY26 earnings call that the company’s integrated model — from iron ore mining to pellets and DRI — is now generating structural cost advantages that competitors find difficult to replicate. Management remains focused on ramping up the wire rod mill and leveraging the slurry pipeline to significantly cut logistics costs in FY27. The copper entry via Chemaf is viewed as a long-term diversification lever, while domestic operations remain the primary growth engine.
People Also Ask — FAQ Section
Q1. What were Lloyds Metals and Energy Q4 FY26 results?
Lloyds Metals reported consolidated PAT of ₹3,828.64 crore for FY26, with Q4 FY26 standalone income surging 310% YoY to ₹4,977 crore. EBITDA margin expanded to 42.39% on a consolidated basis in Q4.
Q2. When did Lloyds Metals declare its Q4 FY26 results?
The Board of Directors approved the audited Q4 and FY26 financial results on May 5, 2026.
Q3. Did Lloyds Metals declare a dividend for FY26?
Yes. The Board recommended a final dividend of ₹1 per equity share (100% on face value) for FY2025–26, subject to AGM approval at the June 19, 2026 meeting.
Q4. How much did Lloyds Metals’ iron ore production grow in FY26?
Iron ore production grew 120% YoY to 21.96 million tonnes in FY26. Q4 alone saw a 529% YoY surge in volumes to 9.1 million tonnes.
Q5. What is Lloyds Metals’ FY27 production guidance?
Management has guided for approximately 34–35 million tonnes of iron ore volumes from Odisha operations in FY27, implying nearly 39% growth over FY26 levels.
Q6. Why did Lloyds Metals’ EBITDA margin expand so sharply?
The margin expansion was driven by a higher share of value-added products (pellets over raw ore), full pellet plant utilization, slurry pipeline cost savings, and improved DRI realization — all contributing to structural operating leverage.
Q7. What new businesses is Lloyds Metals entering?
The company is entering the global copper-cobalt market through a 49% stake in Chemaf in the DRC, and is also investing in a Papua New Guinea mining project to diversify revenue sources beyond Indian iron ore.
Conclusion
Lloyds Metals and Energy’s Q4 FY26 results represent more than just a strong quarter — they signal the arrival of a fully transformed, integrated metals powerhouse. With consolidated revenue doubling, PAT growing 163%, record iron ore production, and bold international acquisitions, LLOYDSME is firmly positioned among India’s fastest-growing mid-to-large-cap metals companies. Investors and market participants will now closely watch FY27 execution, especially the wire rod mill ramp-up, copper venture progress, and the 34–35 MT iron ore volume guidance.
Disclaimer: This article is for informational purposes only and does not constitute investment advice. Please consult a SEBI-registered financial advisor before making investment decisions. All financial data is sourced from company filings and publicly available information.we are not responsible any loss.